
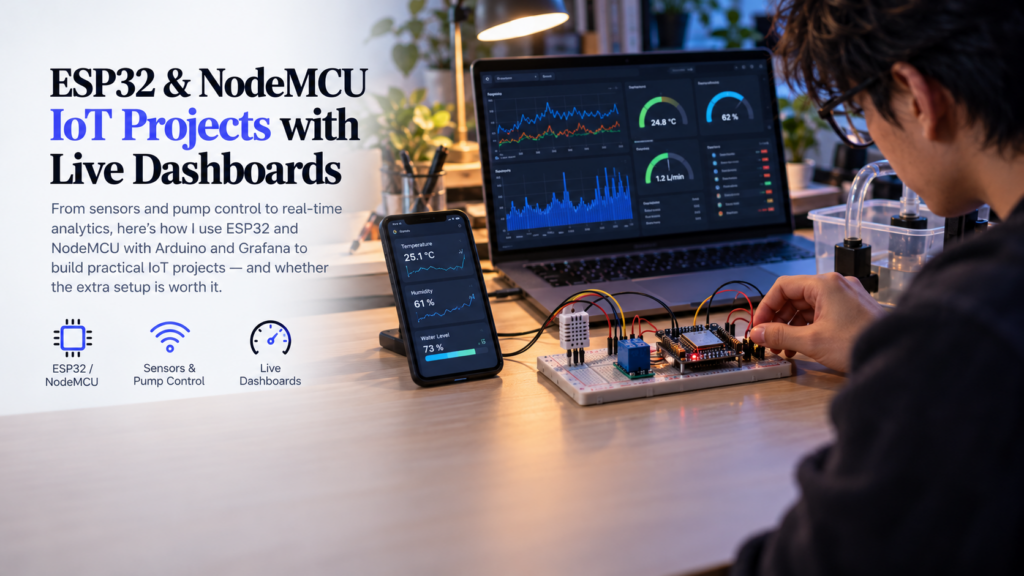
This grafana review comes from a practical angle: I run sensor and pump telemetry projects on ESP32 boards, and I wanted to know whether Grafana is worth the setup effort compared to simpler tools. I tested Grafana OSS self-hosted on a small Ubuntu box, alongside Grafana Cloud’s free tier, feeding data from an ESP32 via MQTT and InfluxDB. (Our test build was on the 10.4 line, which is now a couple of major versions behind — Grafana is up to v13 at the time of writing, so check the current release notes if a specific feature matters to you.) The short answer: it is a serious analytics tool, not a weekend hobby dashboard.
Quick Verdict (★★★★☆ 4/5)
Grafana earns four stars in this grafana review for depth of visualization and alerting, losing a point for the setup burden it places on beginners. It is not plug-and-play for anyone coming straight from Blynk.
Who Grafana is best for
Students and makers comfortable with some DevOps work, who want production-grade dashboards and historical analytics without worrying about a telemetry-tier price jump, will get real value here.
Who should skip it
If you just want a working mobile dashboard today for a single ESP32 project, Grafana will slow you down. A tool like Nodik gets you there faster.
What Is Grafana
Grafana is an open-source visualization platform originally built for monitoring server metrics, now widely used for time-series data of all kinds, including IoT telemetry. You can read its origin story on Wikipedia.
Open-source origins and hosted Cloud option
You can self-host Grafana OSS for free, or use Grafana Cloud, a hosted version with its own free tier. Both were part of this grafana review, since makers tend to ask which path costs less in practice.
How it fits into an ESP32/ESP8266 IoT stack
Grafana does not talk to your ESP32 directly. It reads from a time-series database, typically InfluxDB or Prometheus, which your board (or a bridge script) writes to. That extra layer is the main difference from tools covered in our open-source IoT platform roundup.
Grafana vs a dedicated IoT dashboard
A dedicated dashboard app receives device data and renders it immediately. Grafana requires you to build the pipeline first. That tradeoff is the core theme of this grafana review.
Key Features
Data source connectors
Grafana supports InfluxDB and Prometheus natively. For MQTT, Grafana Labs ships its own official MQTT data source plugin (Grafana 11+), but it’s a separate install and it only streams live values into a panel — it doesn’t store history or support alerting. For anything you want to log, chart over time, or alert on, you’re still writing a bridge that converts MQTT messages into database rows Grafana can query.
Panel types and dashboard customization
Time-series graphs, gauges, heatmaps, and tables can all live on one dashboard, with granular control over thresholds, colors, and time ranges — far beyond what most hobbyist dashboards offer.
Alerting rules and notification channels
Alerting is genuinely one of Grafana’s strongest features. You can set multi-condition rules and route notifications to email, Slack, or webhooks — useful for pump or temperature failure alerts that a basic dashboard app can’t match.
User management and sharing options
Teams and agencies can set role-based access and share read-only dashboard links, which matters if you’re reporting telemetry to a client rather than just yourself.
Performance in Real Use
Setting up a sensor data pipeline from ESP32 to Grafana
In our testing, getting an ESP32 DHT22 setup (similar to the one in our DHT22 temperature dashboard guide) into Grafana took installing InfluxDB, writing a small bridge to convert MQTT publishes into database writes, then building panels from scratch. None of this is difficult individually, but it’s several more steps than a dashboard app that reads MQTT directly.
Dashboard responsiveness with frequent telemetry updates
Once the pipeline was running, panel refresh and query performance held up well even with multiple fields updating every few seconds. Grafana’s backend is built for this kind of load; the bottleneck is always the ingestion layer you build yourself.
Pain points: MQTT streaming isn’t the same as MQTT history
This is the recurring theme of every honest grafana review: Grafana Labs’ own MQTT plugin can show you live values, but it keeps nothing — no history, no alerting. For a pump or sensor project where you actually want to look back or get notified, you still need middleware writing into a real database, and that middleware is one more thing to monitor and keep alive.
Reliability over weeks of continuous logging
We migrated our own production pump controller off Blynk after its free-tier quota couldn’t keep up with a 16-field telemetry stream updating every five seconds — that volume burns through 100,000 messages fast. Grafana’s backend can absolutely handle that kind of load over weeks, provided your database and bridge stay healthy, which is a maintenance job in itself.
Pros and Cons
Where Grafana shines
- Deep historical analytics and custom panel layouts
- Flexible, multi-channel alerting rules
- No message-volume pricing tiers to outgrow the way Blynk’s paid plans work
- Scales well for teams or agencies managing many data sources
Where it falls short for quick hobbyist projects
- MQTT streams live values but keeps no history — a database bridge is still required for logging or alerting
- Requires running and maintaining a separate database
- Steeper learning curve than Blynk or Nodik for a single quick project
Pricing
Self-hosted free tier realities
Self-hosting Grafana OSS costs nothing in licensing fees, but you’re responsible for server uptime, security patches, and backups — real costs in time even if not in money.
Grafana Cloud free tier limits
Grafana Cloud’s free tier includes series and retention limits that matter for an always-on pump or irrigation project logging continuously — you’ll want to check current caps on Grafana’s official pricing page before committing a production device to it.
Hidden costs: hosting your own database
The real hidden cost in any grafana review is the database. InfluxDB or Prometheus needs its own disk space, backups, and occasional tuning as your telemetry volume grows.
How It Compares
Grafana vs Home Assistant dashboards
Home Assistant gives you a working dashboard almost immediately for home automation devices, but its analytics depth doesn’t match Grafana’s panel and alerting options.
Grafana vs Blynk’s paid tiers
Blynk’s paid tiers are priced in message-allowance steps rather than flat per-device pricing, so a jump from occasional updates to frequent telemetry can mean a jump in plan tier too. Our own borewell pump controller hit its 100,000-message monthly cap within days on Blynk’s free tier before we moved it to Nodik. Grafana avoids message-volume pricing entirely, at the cost of setup complexity. See our full Blynk value breakdown for context.
Grafana vs Nodik for simple device telemetry
For straightforward device telemetry, Nodik’s free tier — 4 devices, no card required — is simply faster to get running than standing up Grafana plus InfluxDB. Our pump controller now runs live on Nodik for exactly this reason; read the full story in our Nodik platform review.
Final Verdict
Best use cases
Choose Grafana when you need deep historical analytics, custom panels, and serious alerting across multiple devices or data sources, and you don’t mind the DevOps work involved.
When a simpler tool makes more sense
If you want a working mobile dashboard today, without building a database pipeline, a lighter tool wins. That’s the conclusion of this grafana review, and it’s why so many students in our Blynk alternatives comparison end up on Nodik instead for day-one projects.
Convinced? Here's how to get started: Try it free — no credit card required.
Skip the InfluxDB setup — Nodik gives students and makers a free, 4-device IoT dashboard running in minutes, no card required.
Get new posts by email
Pick the topics you care about — we only email you when something new is published in them.