
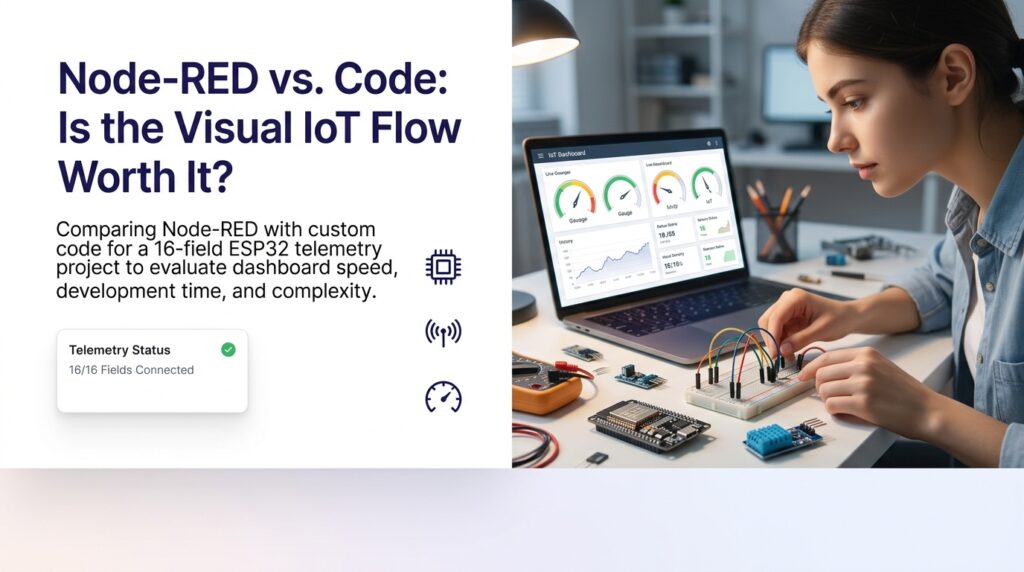
Is Node-RED worth it for a student or hobbyist building ESP32 projects? After testing it with ESP32 telemetry from my pump-controller project, my answer is a qualified yes, with a caveat most reviews skip: it is rarely the whole answer by itself. We ran Node-RED on a Raspberry Pi 4 (the current release at the time of writing is Node-RED 5.0), feeding MQTT data from an ESP32 before routing it elsewhere for display. This review covers what worked, what got messy, and where it belongs in a budget IoT stack.
Quick Verdict (4/5 Stars)
Node-RED earns a solid 4 out of 5. It is free, flexible, and genuinely good at the unglamorous job of routing and reshaping data between devices. It is not, in our experience, a strong standalone dashboard replacement for Blynk or Nodik — the built-in dashboard nodes feel dated next to purpose-built tools.
Who Node-RED is actually worth it for
Students and makers who need custom logic — conditional alerts, data transformation, routing one sensor feed to multiple destinations — get real value here. Anyone building a multi-device automation layer, not just a single gauge display, will find the flow editor saves real coding time.
Who should skip it
If you just want a clean phone dashboard for a temperature sensor or relay, Node-RED is overkill. The setup and hosting overhead outweighs the benefit for a single-purpose project, and a dedicated tool will get you there faster.
What Is Node-RED
Node-RED is an open-source, browser-based tool for wiring together hardware devices, APIs, and online services using a visual flow editor, originally developed by IBM and now maintained under the OpenJS Foundation.
The flow-based programming model
You drag nodes onto a canvas and connect them with wires representing data flow. An MQTT input node can feed a function node that filters values, which then feeds a dashboard widget or an HTTP request node. There is no traditional file of code to maintain, though complex logic still lives inside function nodes written in JavaScript.
Where it fits in an ESP32/ESP8266 IoT stack
Node-RED sits best as middleware: it receives telemetry from an ESP32 over MQTT, applies logic, and forwards the result to a dashboard tool like Grafana. Treating it as the final display layer undersells what it does well.
Key Features
Drag-and-drop flow editor
The editor is genuinely approachable for beginners. Connecting an MQTT subscription to a database write or an email alert takes minutes, not an afternoon of boilerplate code.
MQTT and HTTP nodes out of the box
Both protocols ship as core nodes, which matters for ESP32/ESP8266 builders since most sensor firmware already speaks MQTT. No extra libraries to hunt down.
Dashboard nodes vs dedicated dashboard tools
The original Node-RED Dashboard package (v1) produced functional gauges and charts, but it has been formally deprecated. Its maintained successor is FlowFuse’s Dashboard 2.0, which adds responsive layouts and installable PWA support. Even so, styling and flexibility trail tools built specifically for dashboards, so we treat it as fine for internal debugging, not for anything client-facing.
Self-hosting on a Pi or local machine
Running Node-RED yourself, typically on a Raspberry Pi, means no vendor message quotas. It also means you own the uptime, backups, and security patching.
Performance in Real Use
Setting up MQTT flows for ESP32 sensor data
Wiring an ESP32 publishing on a topic into a Node-RED MQTT-in node took under ten minutes in our test. Parsing JSON payloads and splitting fields for 16 separate telemetry values required more function-node work than expected, but it was straightforward once structured properly.
CPU/memory footprint on a Raspberry Pi
On a Pi 4 running a handful of flows alongside Mosquitto, resource use stayed modest and the device never felt strained during normal polling intervals. Heavier dashboard rendering with many live charts did push memory usage noticeably higher.
Where flows get messy as projects scale
Past a dozen or so nodes, flows become visually tangled without strict naming conventions and grouped subflows. We ended up renaming nearly every node after the fact just to make the canvas readable again — a discipline you need from day one, not after the fact.
Reliability over weeks of continuous operation
Left running continuously, Node-RED itself stayed stable in our setup. Most hiccups traced back to MQTT broker reconnects on the ESP32 side, not Node-RED itself — worth noting if you’re chasing down intermittent gaps in your data.
Pros and Cons
What genuinely saves time
- Visual debugging of data as it moves through the flow
- No quota ceiling since everything runs on your own hardware
- Huge library of community-built nodes for third-party services
Debugging and maintenance pain points
- Flows sprawl quickly without disciplined organization
- The original Dashboard package is deprecated, and its successor (Dashboard 2.0) is still not a dedicated dashboard product
- You are responsible for updates, backups, and security patches
Pricing
Free and open-source core
Node-RED itself costs nothing and carries no licensing fee, which is a genuine advantage over paid dashboard tiers.
Hidden costs: hosting, hardware, and your time
The real cost shows up as a Raspberry Pi or server you now maintain, plus the hours spent organizing flows and fixing broken connections after a power outage. Free software still has a maintenance bill, just paid in time rather than currency.
How It Compares
Node-RED vs Grafana for dashboards
Grafana produces far more polished charts and is better suited to historical analysis once data is already in a database. We covered that comparison in detail in our Grafana review for ESP32 dashboards, and the short version is that Node-RED is better at moving data, Grafana is better at displaying it.
Node-RED vs Nodik for quota-free telemetry
My own borewell pump controller ran on Blynk until its free-tier message quota depleted within days — 16 fields updating every five seconds burns through 100,000 messages fast. We migrated that production controller onto Nodik for the live dashboard, since Nodik’s free tier includes 4 devices with no card required — enough to run a real project, not a crippled demo. That is a case where a purpose-built dashboard beat a self-hosted flow engine.
When to combine Node-RED with another dashboard tool instead of replacing it
Our recommendation is to use Node-RED as the glue layer — receiving and transforming MQTT data — then hand off the visual layer to a dedicated tool such as Grafana. If you only need a ready-made ESP32 dashboard, a purpose-built platform like Nodik skips the glue layer entirely. Trying to make Node-RED do both jobs stretches its dashboard nodes past what they are best at. For a broader survey of free options, see our rundown of open-source IoT platforms for ESP32 makers.
Final Verdict
Is the learning curve worth it for hobbyists
For students comfortable experimenting and willing to maintain their own Pi, the time invested in learning Node-RED pays off once you need logic beyond a single sensor-to-screen pipeline. For a first project, it’s more setup than most beginners need.
Our recommendation based on project scale
Small, single-device builds: skip it and go straight to a free dashboard platform. Multi-device projects with conditional logic, alerts, or data routing across services: Node-RED earns its place, paired with a dedicated dashboard tool handling the display your users actually see.
Convinced? Here's how to get started: Try it free — no credit card required.
Skip the quota math and flow-chart fatigue — start free on Nodik and get a live ESP32 dashboard running, no card required.
Get new posts by email
Pick the topics you care about — we only email you when something new is published in them.