
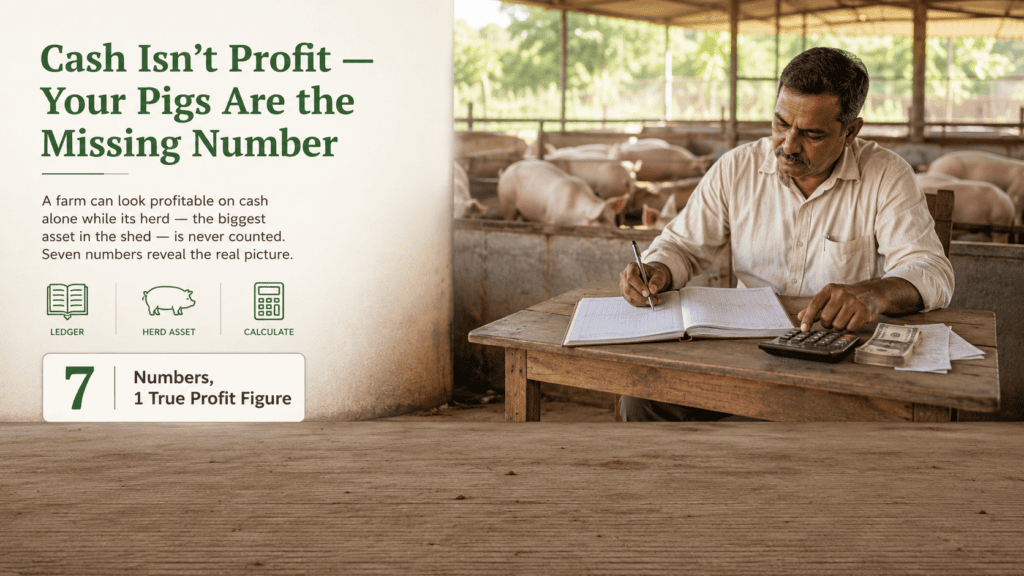
Ask most farmers whether their pig farm makes money and you get an answer based on the tin box: there was cash at the end of the month, so things must be fine. It is an understandable way to think and it is wrong often enough to sink a business. A piggery can run cash-positive for two years while quietly destroying capital, because the money coming in this month was generated by animals and inputs paid for last year — and because the biggest asset on the place, the pigs standing in the sheds, never appears in the reckoning at all.
Profit is a different question from cash, and it has an answer. Below are the seven numbers that answer it, in the order you should work them out.
First, the three traps that hide losses
Before the numbers, the reasons an apparently healthy pig farm can be losing money without anyone noticing.
- Capital spending recorded as an expense. A ₹3 lakh shed is not a ₹3 lakh cost this year. It is an asset that wears out over perhaps fifteen years, so roughly ₹20,000 belongs to this year and the rest belongs to the years to come. Book the whole thing as an expense and this year looks like a disaster; ignore it entirely and every year afterwards looks better than it is.
- Unsold pigs valued at nothing. Twenty growers at 60 kg are stock, and stock has value. If you do not count what is standing in the shed at the start and the end of the year, your profit figure is measuring the wrong thing.
- Free inputs treated as free. Family labour, kitchen waste, maize from your own field, a borrowed vehicle. None of them cost cash, all of them cost something. A pig farm that only works because nobody is paid is a job, not a business — which is a fine thing to run, but you should know which one you have.
Numbers 1 and 2: gross margin per pig and feed cost per kilo of gain
Gross margin per pig is the simplest honest figure on a pig farm: what the animal sold for, minus everything that was spent specifically to produce it. Sale value minus the cost of the weaner, the feed it ate, its share of medicines and vaccines, and the transport to the buyer. What is left contributes towards rent, wages, electricity and, eventually, profit.
Feed cost per kilo of gain sits inside it and deserves its own line, because on almost every pig farm feed is the single largest recurring cost. In the NABARD-format model project published on TNAU’s Agritech portal, feed outweighs labour, medicines, insurance and equipment put together. The calculation is feed conversion ratio multiplied by feed price per kg — if your pigs convert at 3.5 and you pay ₹30/kg, every kilo of pork on the hoof cost you ₹105 in feed alone before anything else is counted.
These two numbers together will tell you within an hour whether the operating side of the pig farm works. If gross margin per pig is negative, no amount of scale fixes it — selling more pigs simply loses money faster.
Number 3: the value of the pigs still standing in your sheds
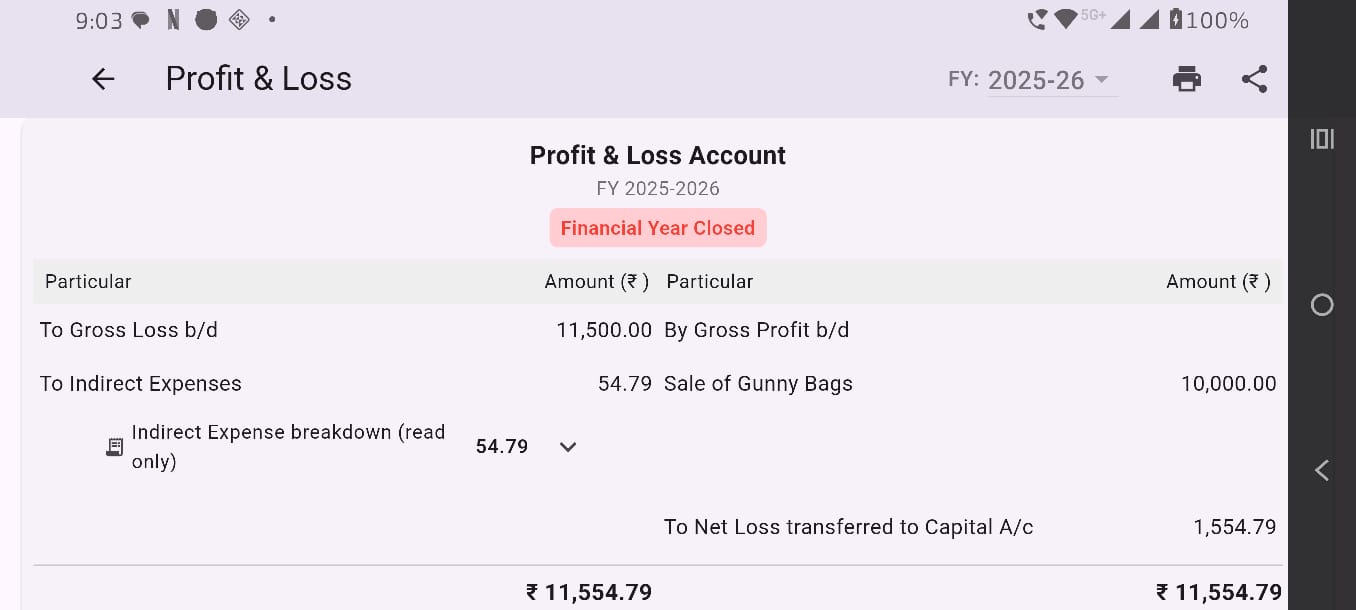
This is the number that separates a real profit figure from a guess, and it is the one hand-kept books almost always miss. A growing herd converts cash into pigs. If you started the year with ₹80,000 of stock and ended with ₹2,20,000 of stock, you generated ₹1,40,000 of value that never touched your cash box. Measure profit by cash alone and you have just recorded your best year as a bad one.
It works the other way too, and that is the dangerous direction. A farm that sells down its herd looks flush for a season, because it is turning assets into cash and calling the cash income. The books balance only when opening and closing herd value are both in them.
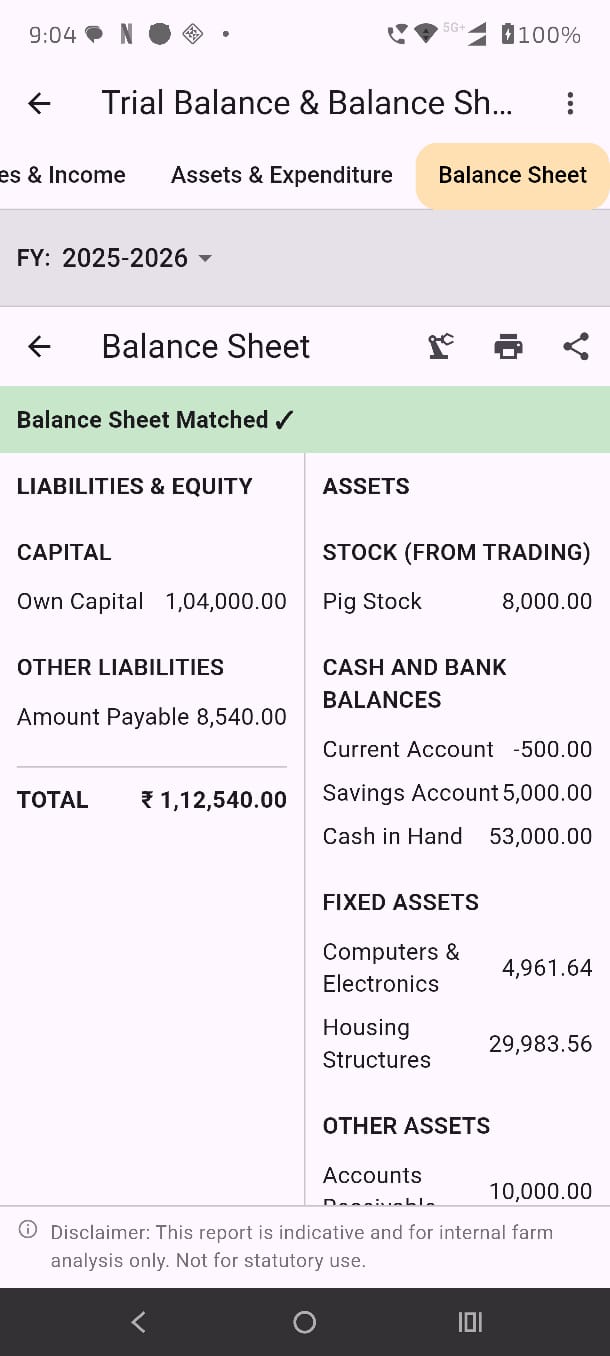
Valuing the herd is a judgement call, so make it a consistent one. Two defensible methods: value each category at what you could realistically sell it for today (weight × current market rate per kg), or value it at what it has cost you to get it to this point. Pick one, write down which one you picked, and use the same method every year. Switching methods between years is how a pig farm accidentally invents a profit.
Number 4: break-even — the point where the farm stops bleeding
Break-even tells you the revenue at which the pig farm stops losing money. It needs your costs split into two piles: variable costs that rise with every extra pig (feed, weaners, medicines, transport) and fixed costs that do not (rent, a permanent wage, electricity, insurance, depreciation).
- Contribution margin ratio = (Revenue − Variable costs) ÷ Revenue
- Break-even revenue = Fixed costs ÷ Contribution margin ratio
- Margin of safety = Actual revenue − Break-even revenue
We have walked through a fuller pig farm break-even calculation separately if you want the long version.
Worked through: a pig farm turning over ₹12,00,000 with ₹8,40,000 of variable cost has a contribution margin ratio of 30%. Against ₹2,00,000 of fixed cost, break-even revenue is ₹6,66,667. Actual revenue of ₹12,00,000 leaves a margin of safety of ₹5,33,333 — turnover could fall by 44% before the farm started losing money. That is a genuinely useful thing to know before you sign a loan.
Illustrative only — the figures above are a worked example, not survey data. Substitute your own fixed and variable costs.
Number 5: output per sow per year
Every breeding pig farm carries the cost of its sows all year whether they produce or not. The efficiency measure is therefore pigs sold per sow per year, and it is where the biggest differences between one pig farm and the next show up.
The Queensland Government’s piggery performance standards put the range for commercial units at 21.5 pigs sold per sow per year at the “fair” end and 25.0 at “very good”, on 2.1 to 2.4 litters per sow annually. The NABARD-format Indian model referenced above works on more conservative assumptions — 11 piglets per farrowing, two farrowings a year, 20% mortality among weaners and 10% among fatteners — which nets out far lower.
The gap between those two sets of assumptions is worth sitting with, because it is almost entirely mortality and reproductive management rather than genetics or feed. A sow that raises fourteen pigs to sale in a year and one that raises eight cost you nearly the same to keep.
Number 6: how long your money is stuck
A pig farm can be profitable on paper and still be unable to pay for feed on Friday. The measure that catches this is the cash conversion cycle — how many days pass between paying for an input and being paid for the output it became.
- Debtor days — how long buyers take to actually pay you after collecting pigs.
- Inventory days — how long feed sits in the store before it is eaten.
- Creditor days — how long you take to pay your own suppliers.
Debtor days are the one to watch on a small pig farm, because trade credit to a buyer is an interest-free loan you did not agree to give. A trader who collects pigs on Monday and settles in six weeks has your working capital for six weeks. Track it and it becomes negotiable; leave it untracked and it becomes normal.
Number 7: the price you actually realise
The last number is the one farmers control least and think about most. Everything above is cost discipline; this is the revenue side, and on a small pig farm it is very often where the largest single improvement is available — not because costs do not matter, but because a price improvement drops straight to the bottom line with no extra feed behind it.
Work out your realised price per kilo liveweight: total received, divided by total kilograms sold. Then compare it with what pigs are actually fetching elsewhere in your state. If you consistently sit below, the problem is usually visibility rather than quality — you are selling to whoever turns up at the gate. That dynamic is worth understanding in detail, and we have written about how pig feed cost eats into profit and about the cash flow problems that follow separately.

Where the money actually goes
To see why the seven numbers are ordered the way they are, it helps to look at the shape of a pig farm’s cost base. The chart below breaks down the project cost heads in the NABARD-format model project — capital and recurring items over the first two years combined.
Source: NABARD-format model pig farming project, TNAU Agritech portal. One specific model for one specific unit size — your own cost shape will differ, particularly if you already own the land or buildings.
Two things stand out. Buildings and feed dominate, and they behave completely differently: one is a fixed cost you pay once and live with, the other is a variable cost you pay forever. Medicines and vaccines, at the other end, are almost invisible — which is precisely why cutting them is such a bad trade. The saving is trivial and the downside is a whole batch.
Doing this without an accountant
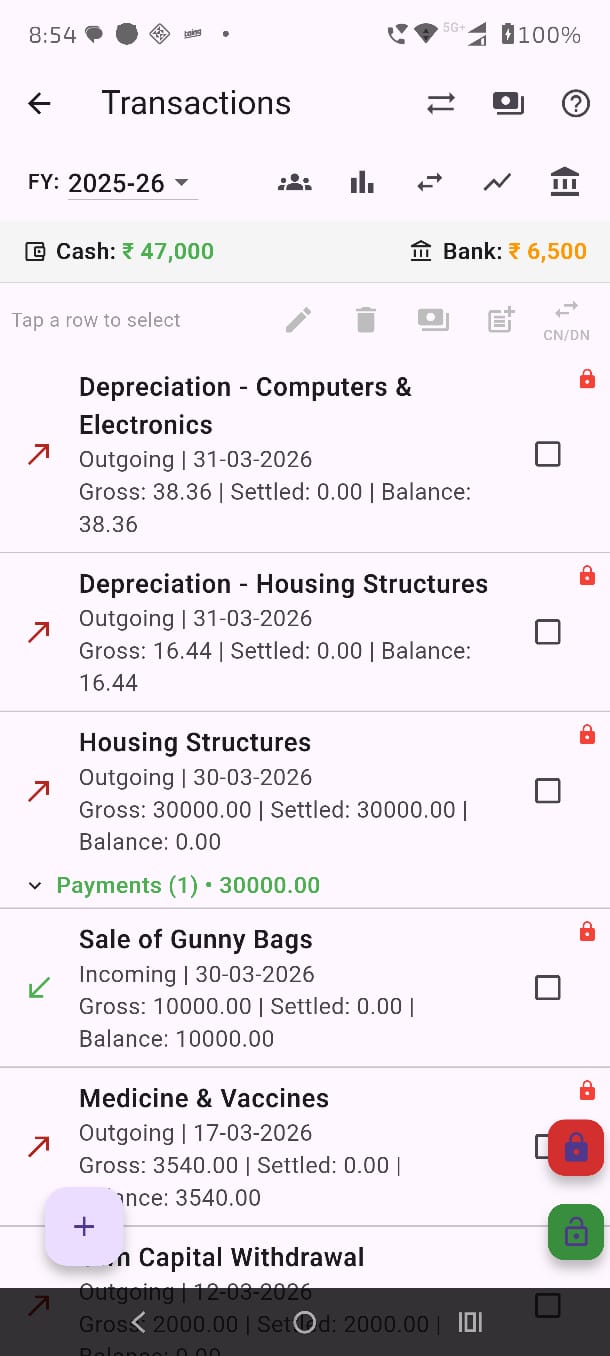
None of these seven numbers is difficult. All of them need the same thing: every rupee in and out, recorded on the day it happened, under a heading that means something. That is the actual bottleneck on a small pig farm, and it is why so many farms genuinely do not know whether they are making money.
If you are borrowing, that export matters more than it sounds. Lenders under NABARD-refinanced schemes work from projected and actual accounts, and a pig farm that can produce two years of consistent books is a different proposition from one that produces a notebook.
Start with one financial year
Do not try to reconstruct five years of history for the whole pig farm. Pick the start of the current financial year, value the herd on that date, and record everything from there. In twelve months you will have a real answer instead of an impression — and if the answer is that the pig farm is losing money, you will also have the seven numbers that show you exactly where.
Further Reading
- Why Pig Farms Fail in India
- Reasons a Pig Farm Stops Being Profitable
- Pig Farm Profitability Calculator
More in this series
Get new posts by email
Pick the topics you care about — we only email you when something new is published in them.