
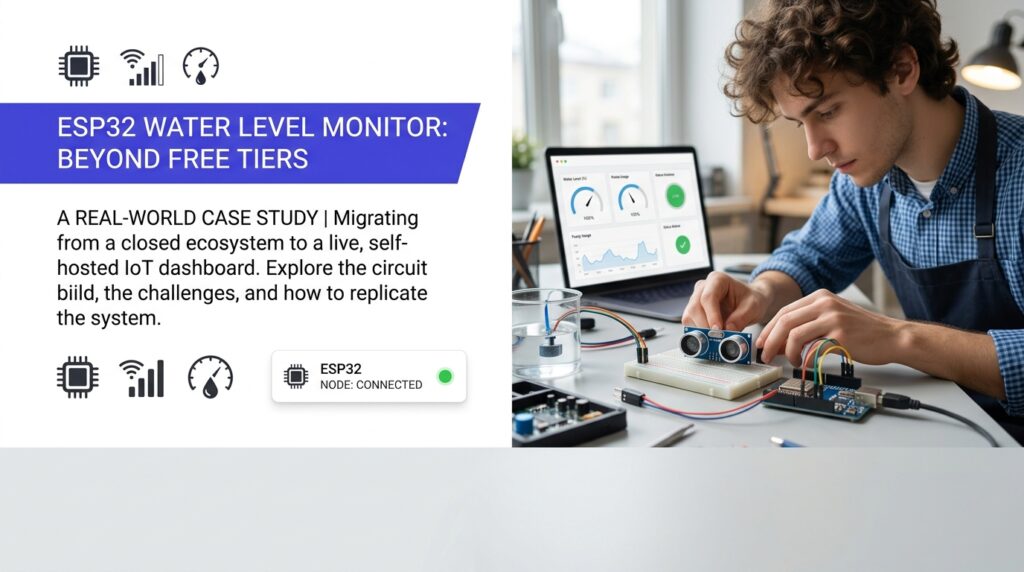
Building an ESP32 water level monitor with live dashboard sounds straightforward until the platform you chose stops sending data mid-night because a quota ran out. That is exactly what happened with a borewell pump controller running on Blynk’s free tier — 16 telemetry fields updating every five seconds burned through 100,000 messages in a matter of days, leaving the pump unmonitored and the tank either overflowing or running dry. This case study documents what that build looked like, why it failed on one platform, and how migrating to a free alternative restored reliable, real-time visibility. For a broader comparison of dashboard platforms that work well with ESP32 projects, the free IoT dashboard tools for ESP32 guide covers the landscape in detail.
The appeal of an ESP32 water level monitor with live dashboard is real: the ESP32 microcontroller costs a fraction of proprietary sensor nodes, the Wi-Fi stack is built in, and open-source libraries handle most of the heavy lifting. According to a 2023 study published in Nature, low-cost IoT water monitoring systems built on commodity microcontrollers can match laboratory-grade sensors in accuracy for turbidity, depth, and flow rate when calibrated correctly — making the case that budget hardware is no longer a meaningful compromise. The challenge, as the borewell build confirmed, is not the hardware. It is sustaining a free, reliable data pipeline from sensor to screen.
What Is an ESP32 Water Level Monitor With Live Dashboard
Definition and Background
An ESP32 water level monitor with live dashboard is a hardware-software system that uses an ESP32 microcontroller, one or more depth or proximity sensors, and a cloud or local dashboard to display real-time water level data. The ESP32 reads sensor values — typically from an ultrasonic module such as the HC-SR04 or a submersible pressure sensor — converts them to a depth or percentage reading, and publishes that data over Wi-Fi using MQTT or HTTP. A dashboard platform receives the payload and renders it as gauges, line charts, or alert cards that anyone with a browser or mobile app can view from anywhere.
The concept gained traction alongside the explosion of cheap microcontrollers and free cloud tiers. The ESP32 on Wikipedia notes that Espressif’s dual-core chip integrates Wi-Fi, Bluetooth, and a rich set of GPIO pins at a price point that made dedicated industrial sensor nodes look absurd by comparison. Students and hobbyists took notice, and water level monitoring became one of the canonical first IoT projects precisely because the feedback loop is immediate and the real-world application is obvious.
Why It Matters
Water scarcity and pump efficiency are not abstract concerns. The UN’s Food and Agriculture Organization reports that agriculture accounts for roughly 70 percent of global freshwater withdrawals, much of it lost to unmonitored over-irrigation or pump failures. At the household level, an unmonitored overhead tank overflows silently for hours; a borewell pump running dry burns out its motor. A live water level monitor with dashboard visibility converts a passive infrastructure problem into an active, manageable one — and the ESP32 makes that conversion accessible to anyone who can solder a header pin.
Key Benefits of This Monitoring Approach
Primary Advantages
The ESP32 water level monitor with live dashboard setup delivers several concrete advantages over traditional float switches or analog gauges. First, data is continuous and timestamped, so a line chart reveals whether a tank drains faster on weekday mornings or whether the borewell refill rate is declining season by season. Second, threshold-based alerts can trigger a relay to cut pump power before a motor burns, replacing a hardware protection circuit with configurable software logic. Third, because the ESP32 supports deep-sleep modes, battery-powered remote deployments — a field tank far from mains power, for instance — are viable without exotic hardware.
A further advantage specific to MQTT-based builds is the decoupling of publisher and subscriber. The ESP32 publishes sensor readings to a broker regardless of whether the dashboard is open. Historical data accumulates in the background, and a user opening the dashboard at midnight sees a full chart rather than a blank screen. This architecture also makes it straightforward to add secondary subscribers — a Home Assistant automation, a Telegram bot, or a relay controller — without modifying firmware.
Who Benefits Most
Engineering students gain the most immediate value because an ESP32 water level monitor with live dashboard touches every layer of an IoT stack: hardware interfacing, network protocols, cloud services, and frontend visualization. That breadth makes it an unusually complete portfolio project. Homeowners managing overhead tanks or sumps benefit from the automation angle — automated pump cutoff alone can extend motor life significantly. Small-scale farmers and greenhouse operators who monitor irrigation reservoirs represent another natural fit, particularly as research cited in Scientific Reports highlights IoT-driven sensor networks as a practical route to precision water management in agriculture.
How to Get Started
Step-by-Step Overview
The borewell build followed a sequence that works for most ESP32 water level monitor with live dashboard projects regardless of tank type or sensor choice.
- Select and wire the sensor. An HC-SR04 ultrasonic module mounted at the top of a tank measures distance to the water surface. Subtract that reading from the known tank height to derive water depth. For tanks with turbulent surfaces or foam, a JSN-SR04T waterproof ultrasonic module is more reliable.
- Write and flash the firmware. Use the Arduino IDE or PlatformIO. The sketch reads the sensor on a timer, maps the raw distance to a percentage, and publishes the result via MQTT to a broker. Adding a reconnect loop and a watchdog timer prevents the device from going silent after a Wi-Fi dropout.
- Choose a dashboard platform. This is where the borewell build ran into trouble on Blynk. The production controller had 16 fields — water level, pump current draw, inlet pressure, battery voltage, and several relay states — updating every five seconds. At that rate, Blynk’s 100,000-message free-tier quota depletes in roughly three and a half days. The build now runs on Nodik, whose free tier includes four devices with no credit card required — enough headroom for a real production project rather than a capped demo.
- Configure widgets and alerts. A gauge widget for current level, a line chart for historical trend, and a threshold alert for low-water cutoff cover the essential monitoring surface. Add a relay toggle widget if the dashboard should also control the pump.
- Test under real conditions. Run the system for at least 48 hours before declaring it production-ready. Observe reconnect behaviour after router restarts and verify that alert triggers fire correctly at the configured thresholds.
Tools and Resources You Need
The hardware list for an ESP32 water level monitor with live dashboard build is short: an ESP32 development board (the 38-pin WROOM variant is most common), an HC-SR04 or JSN-SR04T sensor, jumper wires, a breadboard for prototyping, and a 5V power supply. On the software side, the Arduino IDE with the Espressif ESP32 board package, the PubSubClient MQTT library, and an account on a free dashboard platform cover the full stack. If the build will control a pump relay, add a 5V single-channel relay module and ensure the firmware includes a software lock to prevent the relay from toggling faster than the pump’s rated duty cycle.
Common Mistakes to Avoid
Mistake #1: Underestimating Message Volume
The most expensive mistake in the borewell build — expensive in lost monitoring time, not money — was assuming the Blynk free tier would be sufficient for a multi-field telemetry stream. A single field updating every five seconds generates 17,280 messages per day. Sixteen fields at the same interval produces 276,480 messages daily, exhausting a 100,000-message quota before the first weekend ends. Anyone planning an ESP32 water level monitor with live dashboard with more than two or three fields should calculate their daily message budget before choosing a platform, not after the quota lapses at 2 a.m.
Mistake #2: Ignoring Sensor Placement and Noise
Ultrasonic sensors mounted at awkward angles, near inlet pipes, or above turbulent water surfaces return erratic readings that look like data corruption on the dashboard. A sensor that should read 80 percent capacity might oscillate between 60 and 95 percent if the inlet flow creates surface ripples directly below the transducer. This sends false alerts and degrades historical data, making trend analysis useless.
How to Prevent Them
For the message-volume problem, choose a platform with unlimited or generous data limits on its free tier, or increase the publishing interval. Sending one reading per minute instead of one per five seconds reduces daily messages by 83 percent with negligible impact on monitoring quality for a tank that changes depth slowly. For sensor noise, apply a median filter in firmware — collect five consecutive readings, discard the highest and lowest, and average the remaining three before publishing. Mount the sensor in a PVC sleeve positioned away from the inlet pipe, and seal the sleeve top to reduce air turbulence inside the tube.
Tips for Getting the Best Results
Pro Tips
Store the last known good reading in the ESP32’s non-volatile storage (NVS or SPIFFS) so that a power cycle or Wi-Fi dropout does not cause the dashboard to display zero or null. Implement a watchdog timer using the ESP32’s built-in hardware watchdog so that a frozen sketch restarts automatically rather than requiring a manual reset. Label MQTT topics descriptively — home/tank/level_pct is far easier to manage six months later than sensor1/data.
For projects that need to run on battery — a rooftop tank without a nearby outlet, for example — configure the ESP32 deep-sleep mode between readings. A build that wakes, reads the sensor, publishes via MQTT, and returns to deep sleep can survive on a 3,000 mAh LiPo for weeks depending on the wake interval. The ESP32’s deep-sleep current draw drops to approximately 10 microamps in most documented hardware configurations, making battery life a function of wake frequency rather than idle consumption.
Advanced Techniques
Once the basic water level monitor with live dashboard is stable, consider adding a second sensor channel for water quality. A TDS (total dissolved solids) sensor paired with the depth sensor gives a more complete picture of tank condition, particularly for rainwater harvesting or aquaculture applications. The Nature study on low-cost water quality monitoring systems demonstrated that commodity sensors for turbidity, pH, and conductivity can be read and published from the same microcontroller without meaningful latency impact, provided the firmware schedules sensor reads sequentially rather than simultaneously.
For multi-tank installations, a single MQTT broker can aggregate readings from several ESP32 nodes, each publishing to a unique topic. The dashboard subscribes to all topics and renders them as separate widgets or overlaid charts. This approach scales a single-tank build into a site-wide monitoring network without additional infrastructure — the broker handles routing, and each ESP32 operates independently.
Frequently Asked Questions
What sensor is best for an ESP32 water level monitor with live dashboard?
The HC-SR04 ultrasonic sensor is the most common choice for open tanks because it is inexpensive and well-documented. For outdoor or partially enclosed tanks, the JSN-SR04T waterproof variant is more reliable. Submersible pressure sensors are better for deep tanks where ultrasonic bounce paths are long or obstructed.
Can this project run without a paid cloud subscription?
Yes. The borewell controller described throughout this post runs on a free tier after migrating away from Blynk. Several platforms offer genuinely usable free tiers for an ESP32 water level monitor with live dashboard — the key is checking the message or device limits before committing to a platform rather than discovering the ceiling mid-project.
How do I add pump control to the monitoring build?
Add a relay module wired between the ESP32 GPIO and the pump power circuit. Subscribe the ESP32 to a separate MQTT topic for relay commands. The dashboard publishes a command payload (“ON” or “OFF”) to that topic, and the firmware toggles the relay accordingly. Include a software interlock that prevents the pump from running when the water level sensor reports below a minimum threshold — this replicates the function of a traditional float switch in software.
Is an ESP32 water level monitor with live dashboard suitable for a final-year engineering project?
Strongly so. The build demonstrates embedded programming, network protocol implementation (MQTT), cloud service integration, and data visualization — a span that covers several modules in a typical electronics or computer engineering curriculum. Adding a quality sensor channel or an ML-based anomaly detection layer, as explored in recent Nature research on IoT water systems, gives the project enough depth for a dissertation-level treatment.
What happens if Wi-Fi drops during monitoring?
A well-written firmware sketch will attempt reconnection on a configurable backoff schedule. During the outage, readings that cannot be published are lost unless the build includes local SD card logging or NVS buffering. For critical applications, store the last 100 readings in a circular buffer in NVS and flush them to the broker upon reconnection to preserve the historical record through brief outages.
See similar results for your project: Try it free — no credit card required.
Start your ESP32 water level project on Nodik's free tier — 4 devices, no card required, live in minutes.
More in this series
- Best Free IoT Dashboard Tools for ESP32 (2026 Guide)
- ESP32 Push Notifications Without Blynk: 5 Ways to Stay Free
- ESP32 IoT Project Checklist Before Submission: The Complete Guide
- ESP32 Home Automation Relay Control From Phone: Complete Setup Guide
- ESP32 Smart Irrigation System for Agriculture: Step-by-Step Build Guide
- ESP32 DHT22 Temperature Dashboard: Build Your Own in 6 Steps
- ESP32 GPS Tracker With Live Map: Build Your Own in 7 Steps
- ESP32 Project Ideas for Final Year Students: 10 Builds That Actually Impress (2026)
Get new posts by email
Pick the topics you care about — we only email you when something new is published in them.